Process Maps: Many Voices Help Make Change

As social service organizations strive to improve the ways in which they change the lives of the communities they serve, identifying obstacles to effective service delivery and thinking creatively about how to solve them remains challenging. Process Maps, a human-centered design tool, can help organizations identify problems and illustrate pathways to possible solutions. A process map can be a vital aid to breaking down complex processes into every decision point, communication, and activity involved, approaching them from the perspective of program participants. Human-centered design is a problem solving approach that places the experiences and opinions of those receiving services at the very center of the process, encouraging program staff members at all levels to center around a shared perspective when collaborating to improve services. This approach can also empower participants to have a say in how services are shaped to better serve them.
The Los Angeles Community College District (LACCD) partnered with MDRC to find ways to improve its Los Angeles College Promise (LACP) program through this human-centered design approach, creating process maps of their service flows for community college students to identify problems and devise potential solutions, and engaging students to help shape program improvements.
The LACP program, part of all nine colleges in the district, aims to increase college access and success among students with on-campus support services and a scholarship that fully covers students’ tuition and fees during their first two years of study. Find out more about LACP and their work here.
Each of the nine community colleges built a process map illustrating their unique implementations of the district-wide College Promise Program and used it as a data collection tool and the central piece of a program improvement workshop. Here’s how they did it, and how you can too.
Gather a range of staff members involved in service delivery to draft the process map
Designate a group of program staff members to create a first draft of what you think your current process looks like from the perspective of your participants. You can start with a relatively small team and make sure that you edit and improve this initial version by discussing it within this group. As you build your first draft, be thorough and cover as many steps as possible in your map, starting with core questions about the process:
- How do participants first hear about the program?
- How do they find out if they qualify?
- How do they apply?
- How do they first meet program staff members?
The more steps represented in the initial map, the better, as they may uncover more possible points that create challenges for your participants.
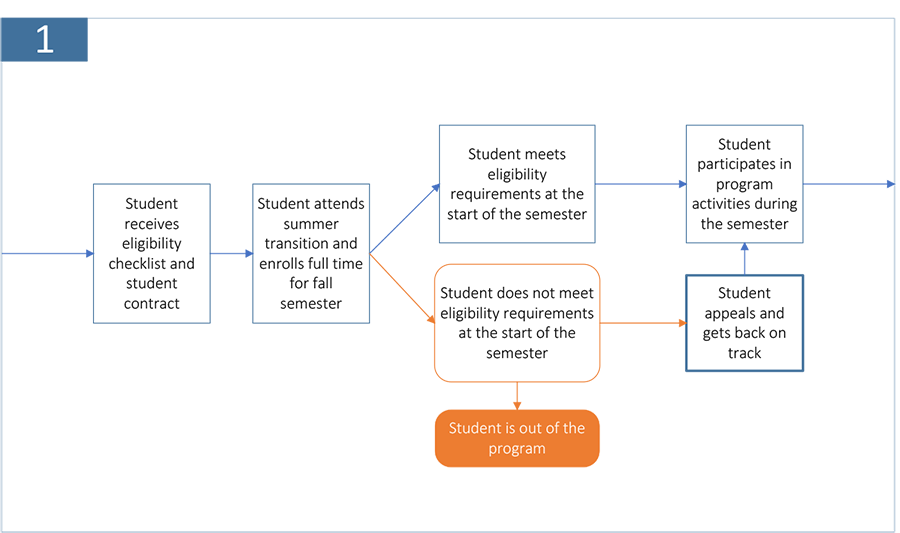
In the Los Angeles example, MDRC, LACCD, and each district college created their initial version of the process map in two steps. First, MDRC and a member of the LACCD team drafted a process map that aligned with the district’s original vision of program implementation. The example shown in Figure 1 and the figures that follow show a simplified section of the full map as a readable illustration of the evolution of the process map:

The full LACP process map can be viewed here.
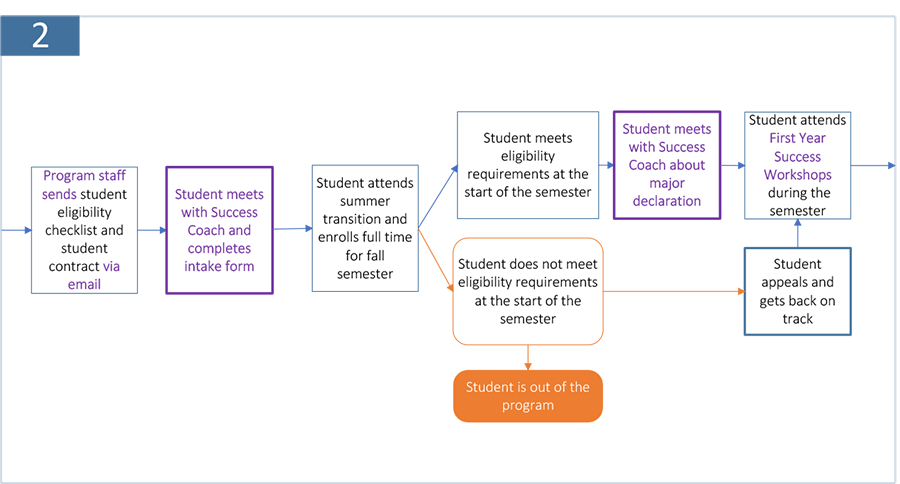
Then MDRC worked with front-line staff members at individual colleges, who filled in gaps with their perspectives and helped make process maps that reflected the program at each individual college, as shown in Figure 2. This shows how programs managed by a central office and implemented at multiple sites can develop a basic template of their process flow, then create customized versions to reflect local experiences.

Process maps can grow to include a large amount of detail, sometimes incorporating multiple user points of view and steps at the periphery of the main process. The level of detail in your map should serve your unique goals for creating one in the first place. In the example of LACP, outlining every step a student takes as part of the program was crucial to increasing the chances that the team could identify as many opportunities for program improvement as possible.
Show it to program participants and get their feedback
Gather some of your participants and show them what you created. Consider organizing a few focus groups where you bring printed versions of your process map and walk participants through it. Ask them to annotate the printed copies along the way, share where the process looked different in their personal experience with your program, and highlight steps that represented special challenges to them.
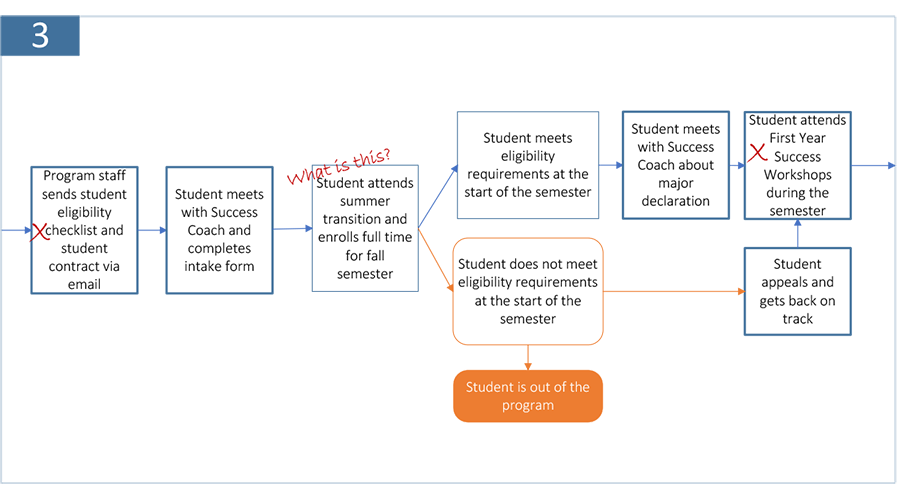
MDRC helped LACCD colleges with this step by running student focus groups as independent researchers. These focus groups resulted in rich and new information for staff members, and clear ideas from students themselves on what the process map had gotten right and wrong, highlighted in the marked-up version shown in Figure 3:

Use the process map to support continuous program improvement
Take some time to dig into the information you collected. It may add to or alter your process map, and could spark some ideas about how to improve your program. For example, some of the Promise students mentioned in focus groups that they had never heard of the program’s summer workshops. Program staff members saw these workshops as important opportunities to prepare students for the school semester and build their own education plans. The student feedback prompted a reevaluation of how staff members communicated to incoming students about summer activities, and how they could help students who missed the workshops catch up.
Summarizing what you learn and sharing it with as many staff members as possible will help tap into your entire team’s creativity and insight. To make the most of what each college had learned, LACP put together a daylong workshop for sharing and discussing the student focus group results, including the annotated process maps. Students also participated, sharing ideas for potential program improvements with each college. The LACCD leadership team also reevaluated the components of the district-wide program model. During the workshop, students mentioned that the program’s book vouchers did not cover other related costs, including fees for accessing online books or course pages with class content and homework assignments. To address the problem, LACCD planned to offer laptops to program students the next year after this workshop, working in partnership with the mayor’s office.
After the workshop, some college staff members made large printouts of their process maps for their offices, and periodically edited them to reflect improvements and new potential challenges. The LACCD office relied on theirs to help focus planning meeting agendas. Process maps are not meant to be static: if you and your team find it helpful to work with process maps, you can make them a valuable tool to build upon year after year.
Read more about creative ways to solve common program challenges in these related In Practice posts:
- Filling All the Seats in the Room: Using Data to Analyze Enrollment Drop-Off
- Recruiting New Participants: Eight Steps to Full Enrollment
- First Impressions Matter: Tips to Keep Participants Coming Back for More
- Show, Don’t Tell, Part 1: Using Nudges to Reach Program Goals
- Show, Don’t Tell, Part 2: Strategies for Creating Nudges Through Program Design


